Case Study
Hope Booth
Quantifying Emotional Uplift in a Live Public Deployment
Hope Booth was already changing lives-but there was no measurable evidence to demonstrate its impact. I designed and led a 5-week mixed-methods evaluation that established a repeatable measurement framework, identified a 19% directional improvement in self-reported hope, and informed multiple product improvements.
Role
UX Researcher
Team
Product Manager, Engineer
Platform
Kiosk + Mobile/Web
Duration
5 Weeks
Study Type
Impact Evaluation
Methods
Mixed Methods
Impact
19% Directional Uplift
Product Outcomes
5 Research-Informed Changes
Timeline
Week 1
Evaluation design + tracking review
Weeks 2-3
Live observation + data collection
Week 4
Analysis + synthesis
Week 5
Stakeholder readout + recommendations
My Role
I led the research end-to-end by:
- Designing the evaluation framework
- Defining success metrics
- Conducting live field observations and post-experience interviews
- Analyzing quantitative and qualitative findings
- Synthesizing insights into product recommendations
- Partnering with Product and Engineering on implementation
The Opportunity
Hope Booth showed promise. The team needed stronger evidence.
Hope Booth transforms old telephone booths into immersive public wellness experiences, guiding people through breathwork, lightbox therapy, and connection to nearby mental health resources. The experience was live, users were responding positively, and the team believed it was having an impact.
But there was no structured evidence to support that belief. No measurement framework. No way to show stakeholders that the intervention actually changed how people felt.
The central question
Does Hope Booth measurably improve how people feel, and what do users need when the experience ends?
No baseline
Hope levels were tracked inconsistently. The prompt wording made it hard to know what users were actually rating.
No post-experience bridge
Users frequently felt uplifted but had no clear path forward. The experience ended without connecting them to ongoing support.
No analytics framework
Session data existed in Mixpanel but had not been structured into a repeatable measurement system.
What We Needed to Learn
Three questions drove the research.
I defined the evaluation framework before any data collection began. The goal was to make sure we were measuring something real, not just generating numbers that looked good.
Does the experience produce a measurable shift in self-reported hope?
The team needed evidence, not anecdote, to justify continued investment and expansion.
Are users interpreting the hope scale the way we intend?
If users were rating long-term life outlook instead of present emotion, the pre/post comparison would be meaningless.
What do users need after the experience ends?
Emotional uplift is temporary without a pathway forward. Understanding what happens next was as important as measuring the shift itself.
Research Approach
Mixed methods, because neither alone would have been enough.
Quantitative data showed us what was happening. Qualitative research told us why. I designed the evaluation to run both in parallel during live public deployment, a real-world constraint that shaped every methodological decision.
Quantitative
Structured pre/post hope ratings captured at the start and end of each session. Mixpanel analytics tracked session completions, emotional descriptor patterns, and engagement drop-off points.
- Pre-session hope level selection
- Post-session hope level selection
- Mixpanel session tracking
- Completion rate analysis
Qualitative
Live observation and brief post-experience interviews at the booth. I conducted these directly, watching how users moved through the experience, then asking a short set of open-ended questions immediately after.
- Live observation during public deployment
- On-the-spot post-experience interviews
- Thematic analysis of emotional language
What We Learned
Three findings. Each one changed something.
The experience produced a real shift in self-reported hope.
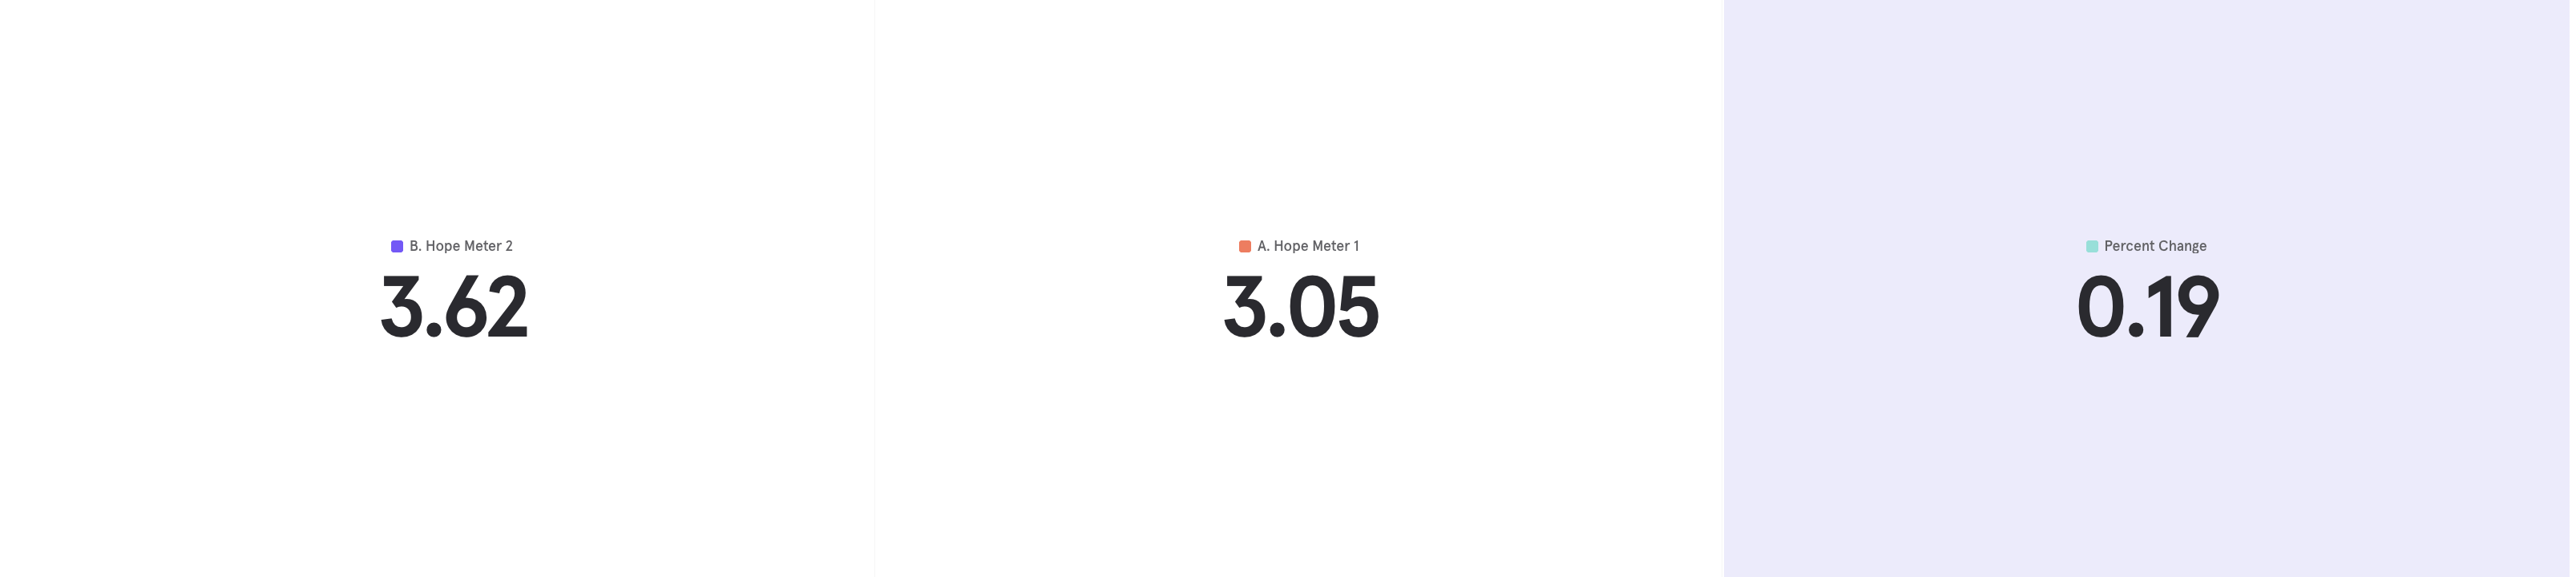
Most completed sessions showed directional improvement, users who entered at lower levels (1–2) frequently exited at higher ones (3–5). The data was consistent enough to move from anecdote to evidence.
Before
0.00
out of 5.0
Uplift
0.00%
directional improvement
After
0.00
out of 5.0
Matched pre/post self-reported hope ratings on a 5-point scale. Sample size and analysis window were not available in the source data; this is directional evidence, not a clinical outcome.
What this influenced
This gave stakeholders something concrete to point to when making the case for continued deployment and expansion funding.
Users weren't rating the same thing.
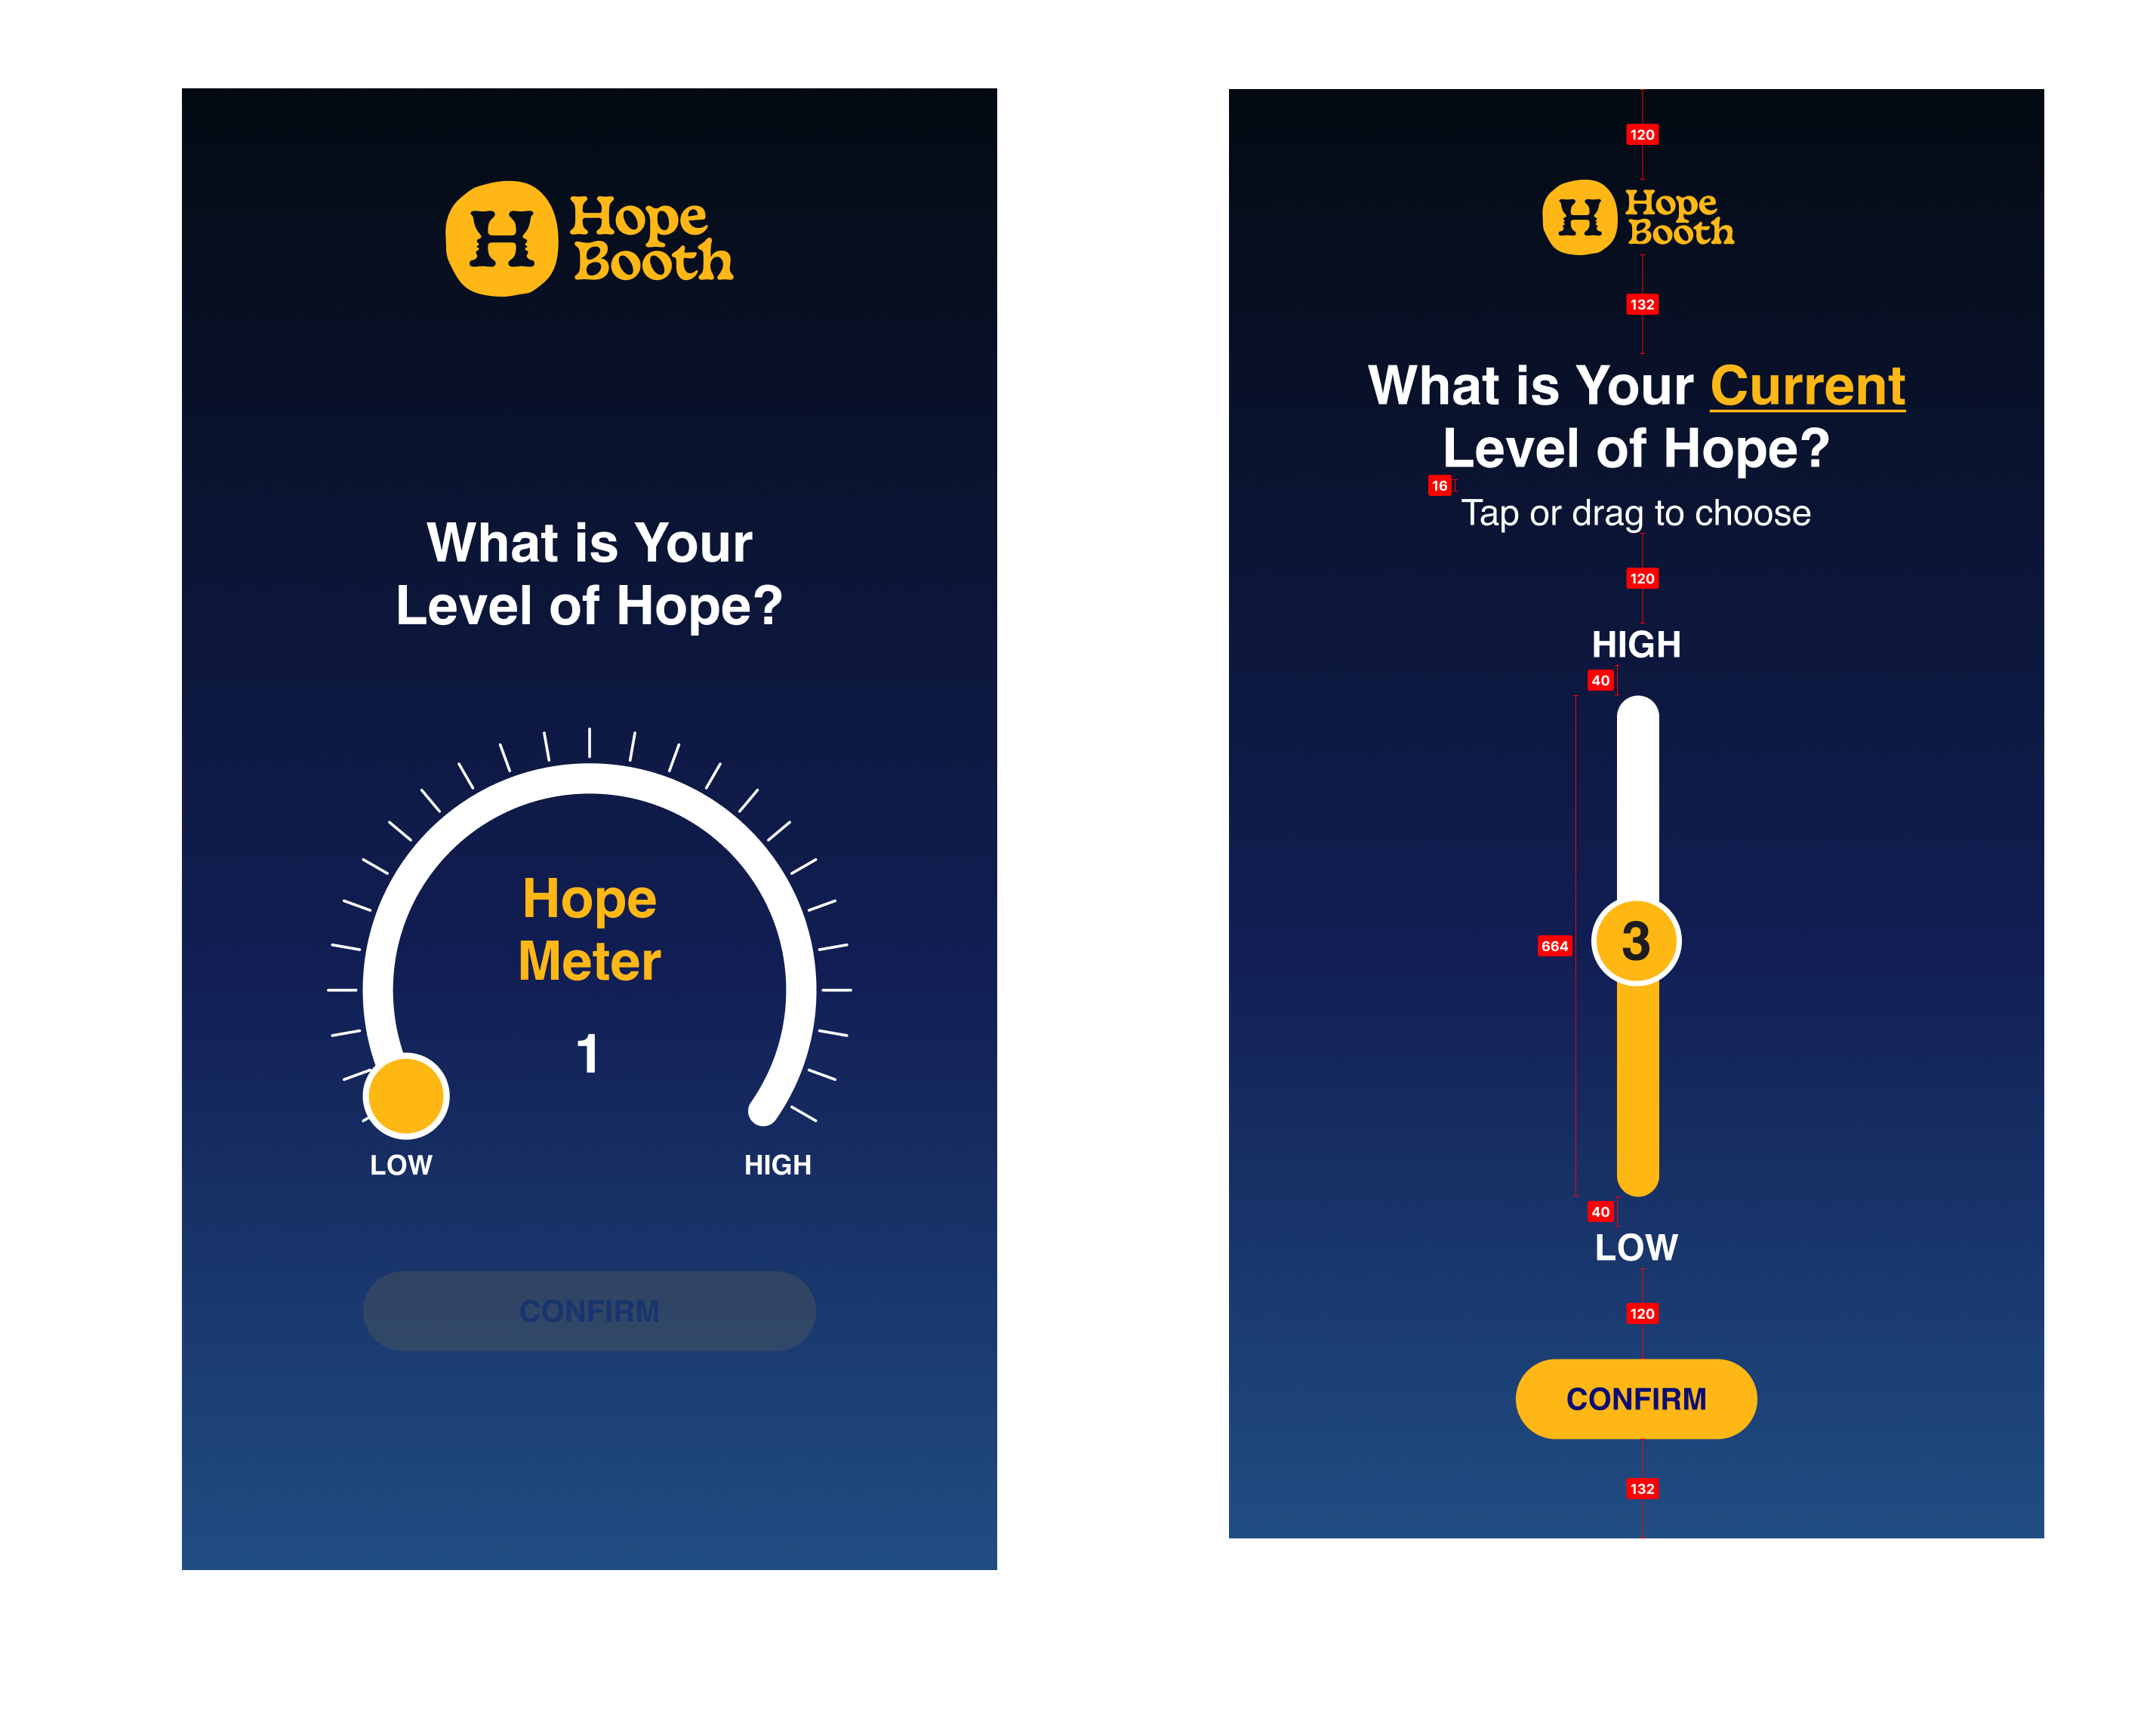
The prompt, "What is your hope level?", led some users to rate their long-term life outlook rather than how they felt in the moment. This undermined the construct validity of the pre/post comparison.
"I rated it low because my situation hasn't changed, not because of right now."
What this influenced
Prompt revised to "What is your current level of hope?", anchoring ratings to present emotion and improving measurement reliability across sessions.
The experience ended. Users didn't know what to do next.
Across live interviews, the same sentiment surfaced repeatedly. Users felt uplifted, and then had nowhere to go with it.
Okay... now what?
How do I keep this?
What do I do next?
The experience was creating a window of openness, but there was nothing inside that window to step through.
What this influenced
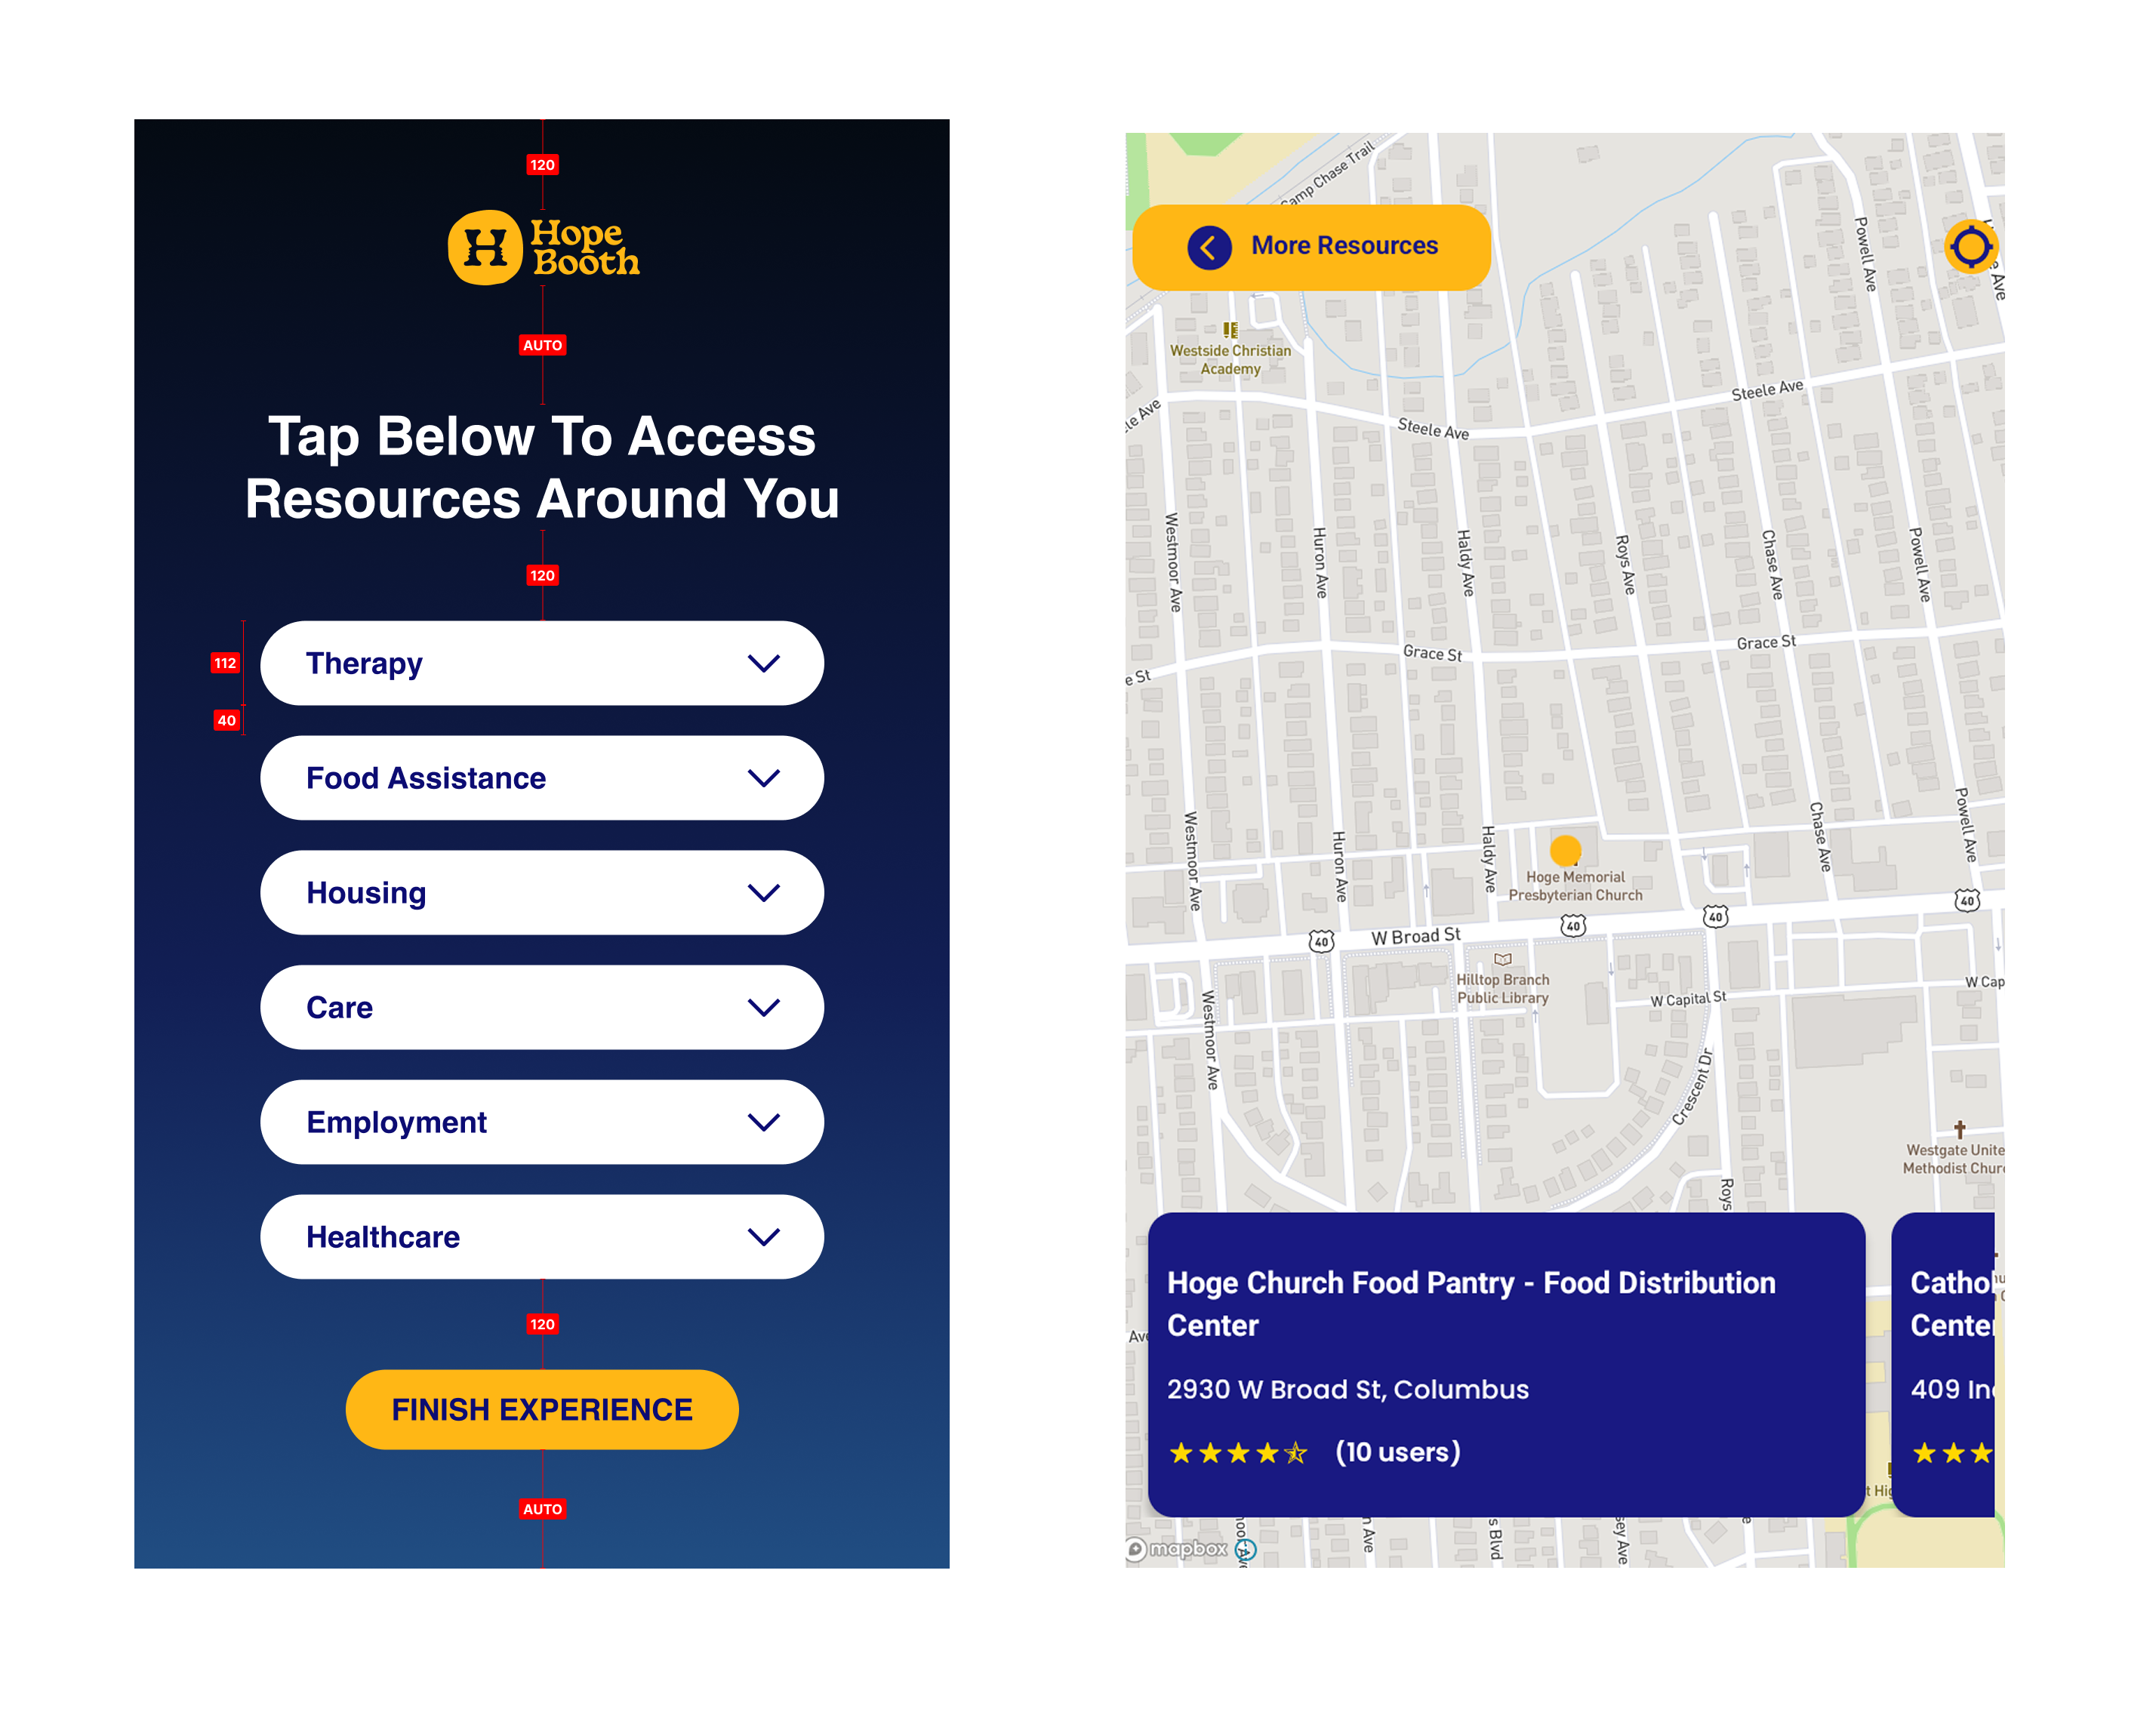
A post-experience resource module was added, connecting users to nearby therapy, food assistance, housing, employment, healthcare, and care services within 5 miles.
What Changed
Business Impact
Each research finding led to a measurable product or business outcome. These changes were implemented to improve measurement quality, user experience, and stakeholder decision-making.
Turned anecdotal success into quantifiable evidence
MeasurementResearch insight
The experience was producing uplift, but no one could prove it.
Decision
Designed a pre/post measurement framework using structured hope ratings and Mixpanel session tracking.
Business outcome
Established a 19% directional uplift as the baseline metric for evaluating deployment effectiveness, something the team could show stakeholders and use to justify expansion.
Fixed the measurement before it invalidated the data
Prompt DesignResearch insight
Users were interpreting "hope level" as a life outlook rating, not a present-moment feeling.
Decision
Recommended revising the prompt from "What is your hope level?" to "What is your current level of hope?"
Business outcome
Increased construct validity of pre/post comparisons. Future sessions can use the revised prompt to improve consistency when comparing results across deployments.
Expanded the product from a moment to a pathway
ProductResearch insight
Users left uplifted, but without any connection to what came next.
Decision
Recommended adding a post-experience resource module based on the recurring 'now what?' pattern from field interviews.
Business outcome
A resource integration was built, connecting users to nearby therapy, food assistance, housing, employment, healthcare, and care services. The product became a support pathway, not just an emotional reset.
Created visibility into real-world support needs
AnalyticsResearch insight
Once resources existed, there was no way to know which ones users were actually selecting.
Decision
Defined a resource engagement tracking framework, top resources selected, emotional baseline relative to resource interaction, continued engagement patterns.
Business outcome
Teams can now see which needs are most common by location, time of day, and emotional baseline, creating an ongoing feedback loop between user behavior and product decisions.
Validated continued investment in the program
Stakeholder ConfidenceResearch insight
Leadership needed more than positive feedback to justify expansion.
Decision
Synthesized quantitative and qualitative findings into a stakeholder-facing readout connecting experience design directly to measurable emotional outcomes.
Business outcome
The research provided the evidence layer the organization needed, moving from "people seem to like it" to "here is what we can show."
Reflection
What this project taught me as a researcher.
On measuring emotional experiences
Emotional constructs are harder to measure than usability. The same question can mean different things depending on what someone walked in carrying. I learned to treat prompt wording as a research decision, not just a UX copy decision.
On balancing quant and qual
The 19% uplift number was credible because the qualitative data gave it context. Neither would have been sufficient alone. The finding about "now what?" only emerged from interviews, the analytics had no signal for it at all.
On translating nonprofit research
The stakes felt different here than on a product feature. Users were in genuinely vulnerable states. That shaped how I conducted interviews, how I framed findings, and what I chose to prioritize in recommendations.
What I would do differently
If I continued this work, I would introduce a lightweight longitudinal follow-up to understand whether emotional improvements persisted over time. This would strengthen the evidence for sustained impact while creating opportunities to measure longer-term engagement with support resources.